Overview
InstaChart Resident Engagement Platform
Task
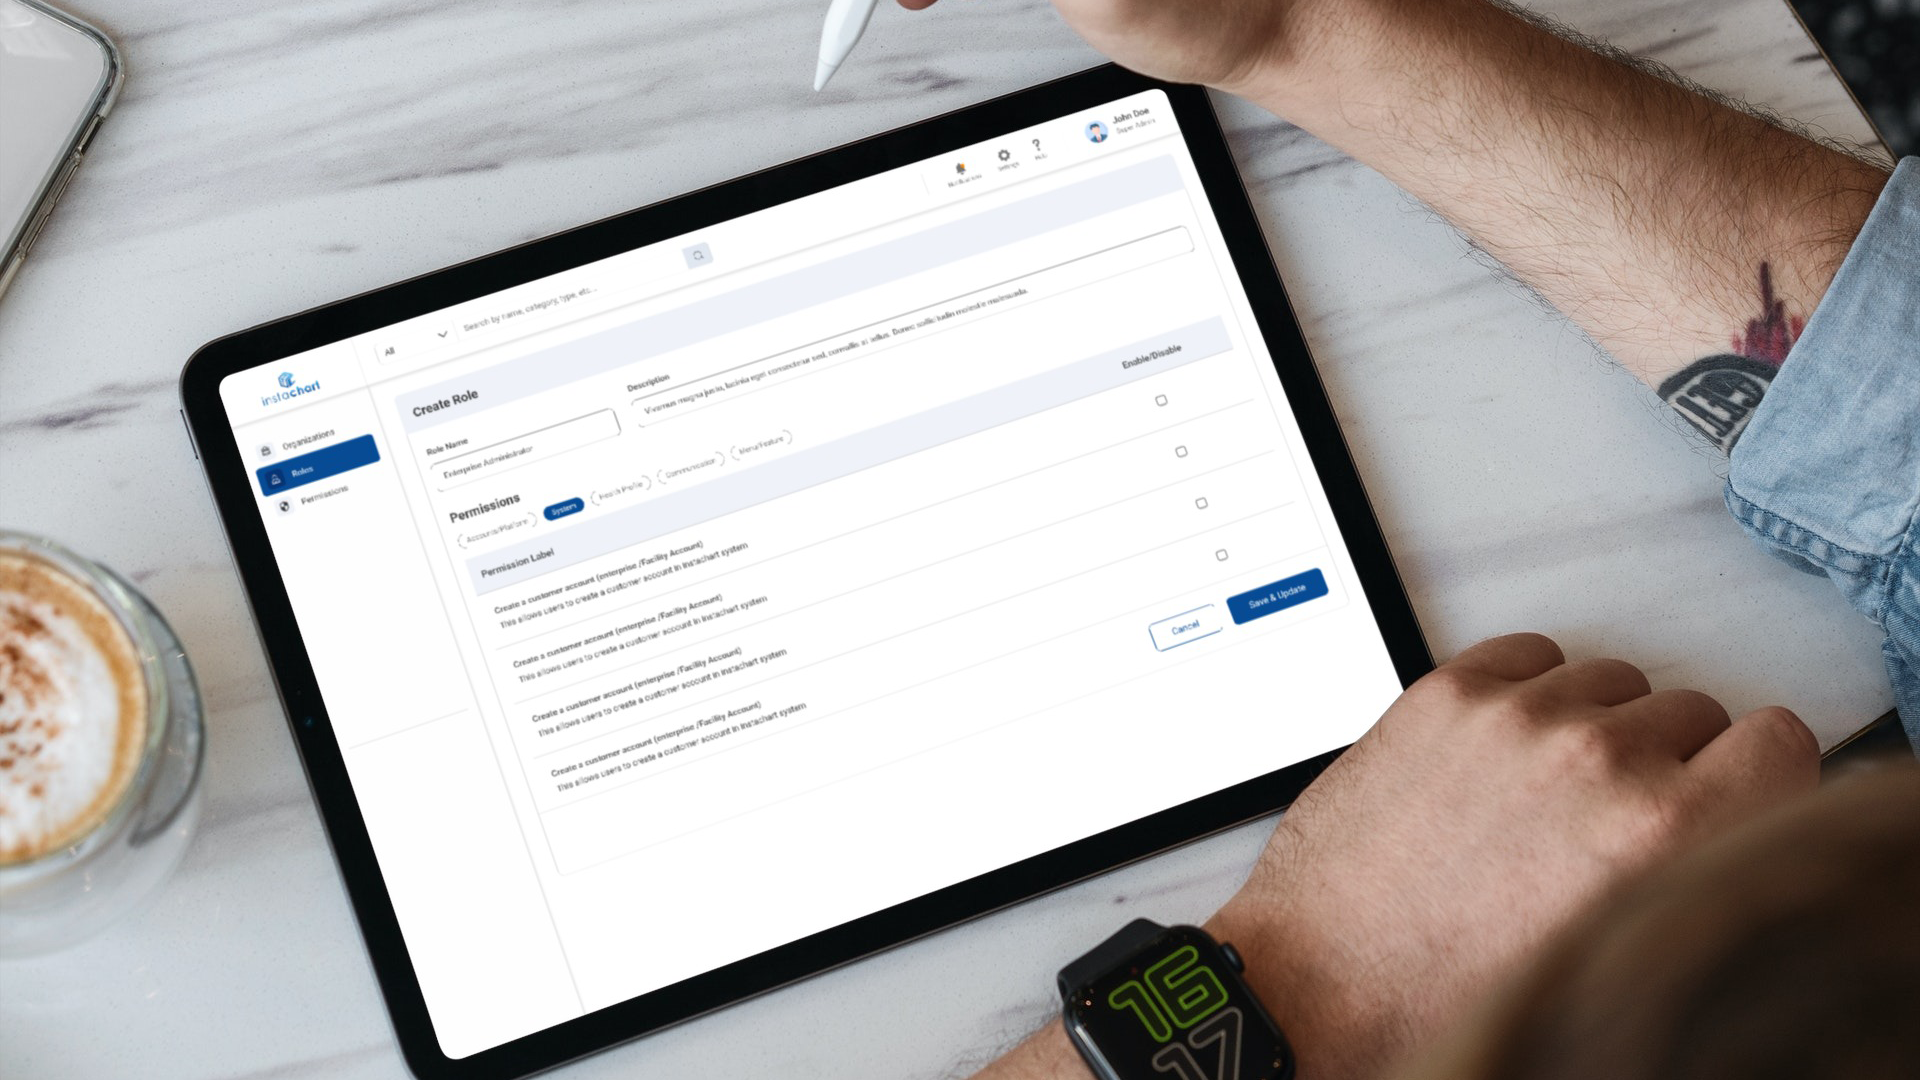
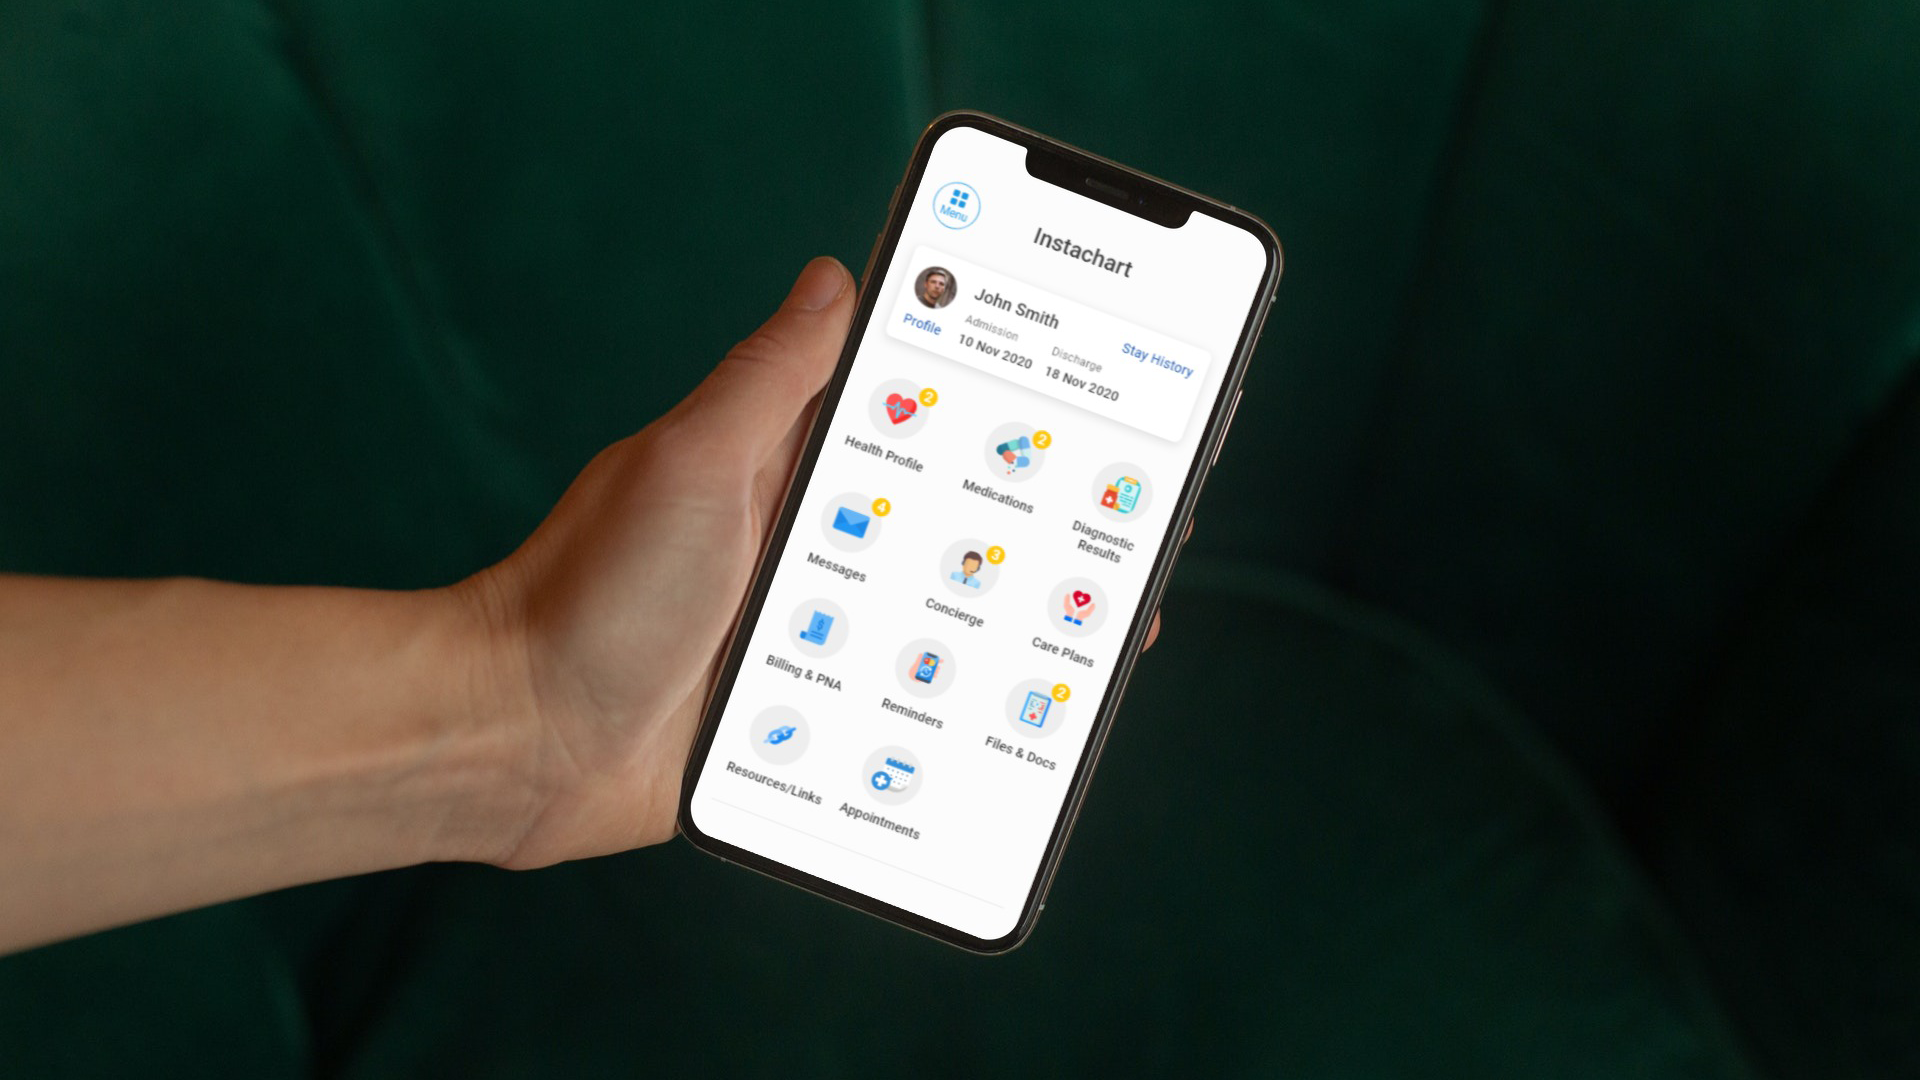
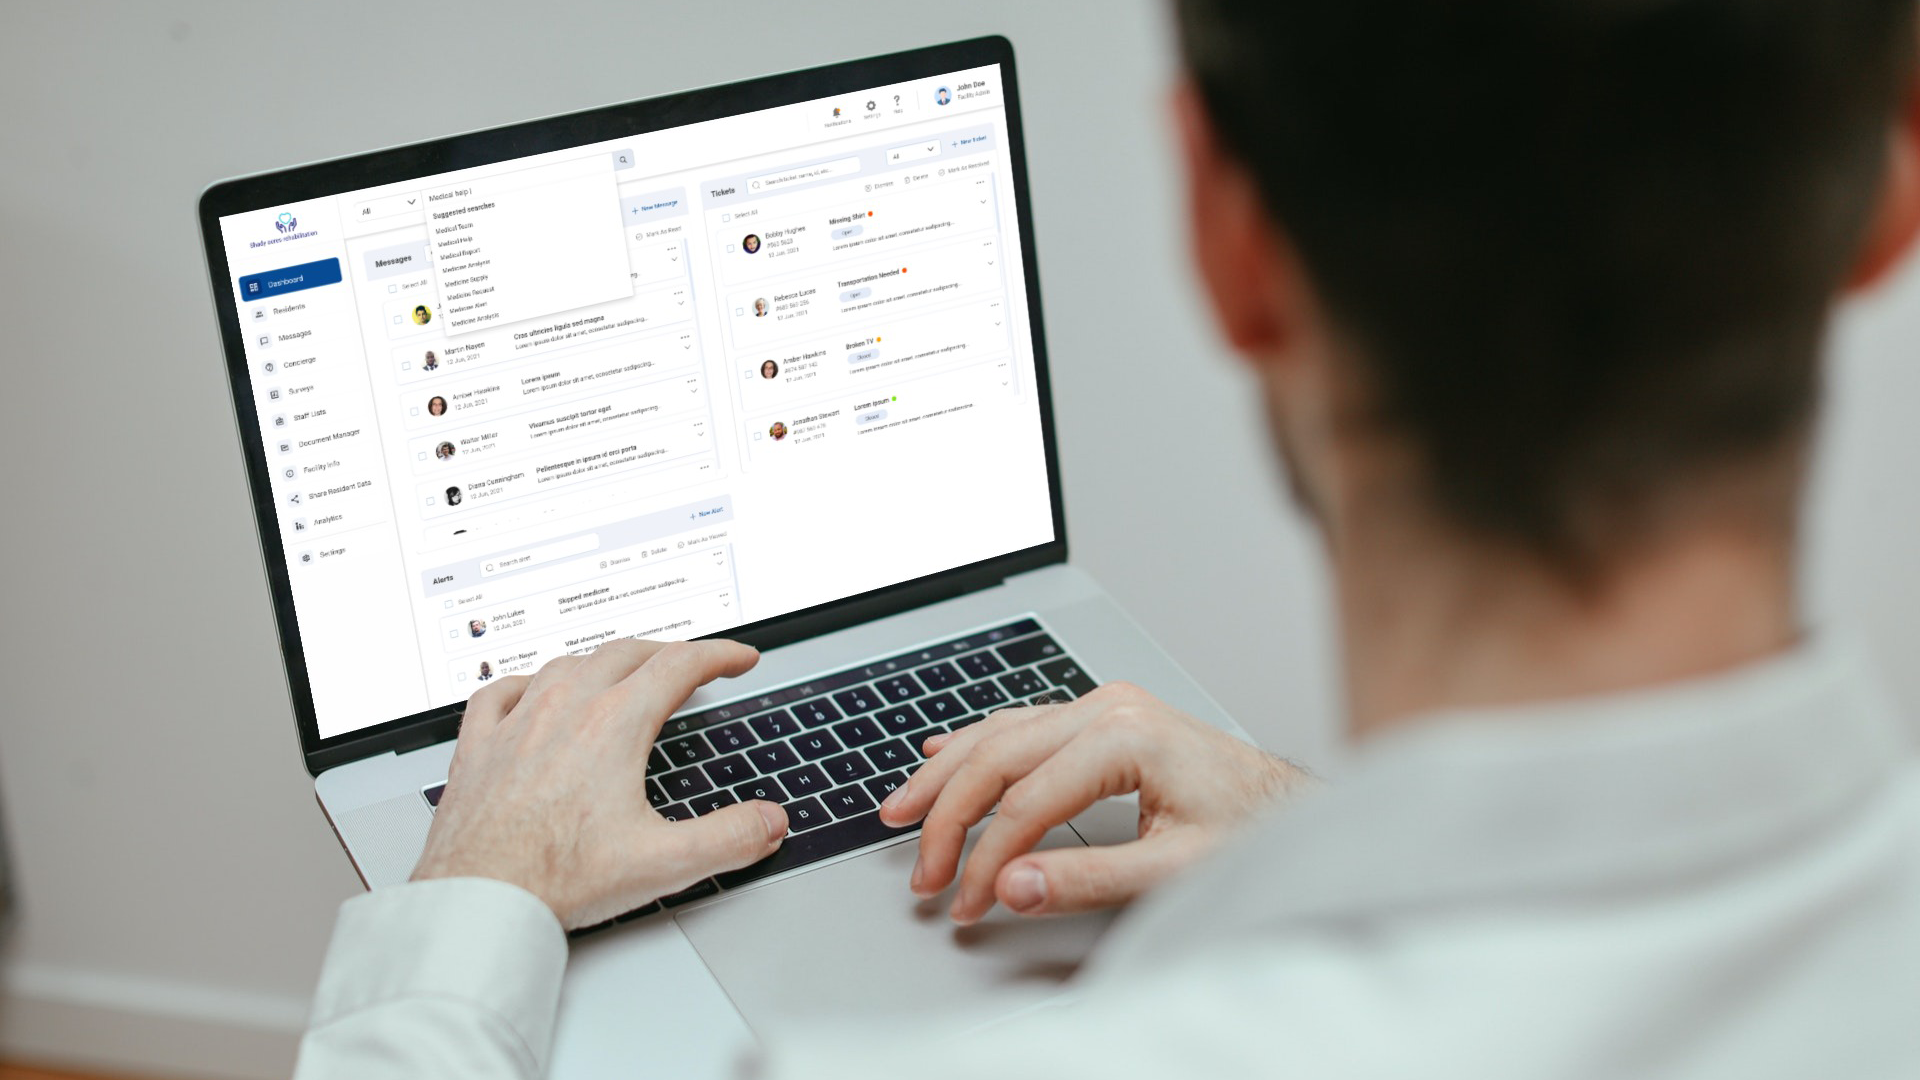
InstaChart Resident Engagement Platform is a solution is intended to improve the communication of nursing facilities with their inpatients /discharged patients and their family members.
To create a Web Application and mobile applications that help facilities and patients, doctors, staffs communicate with each other and track activities.
Challenges
Highly intuitive, functionally sophisticated dashboard
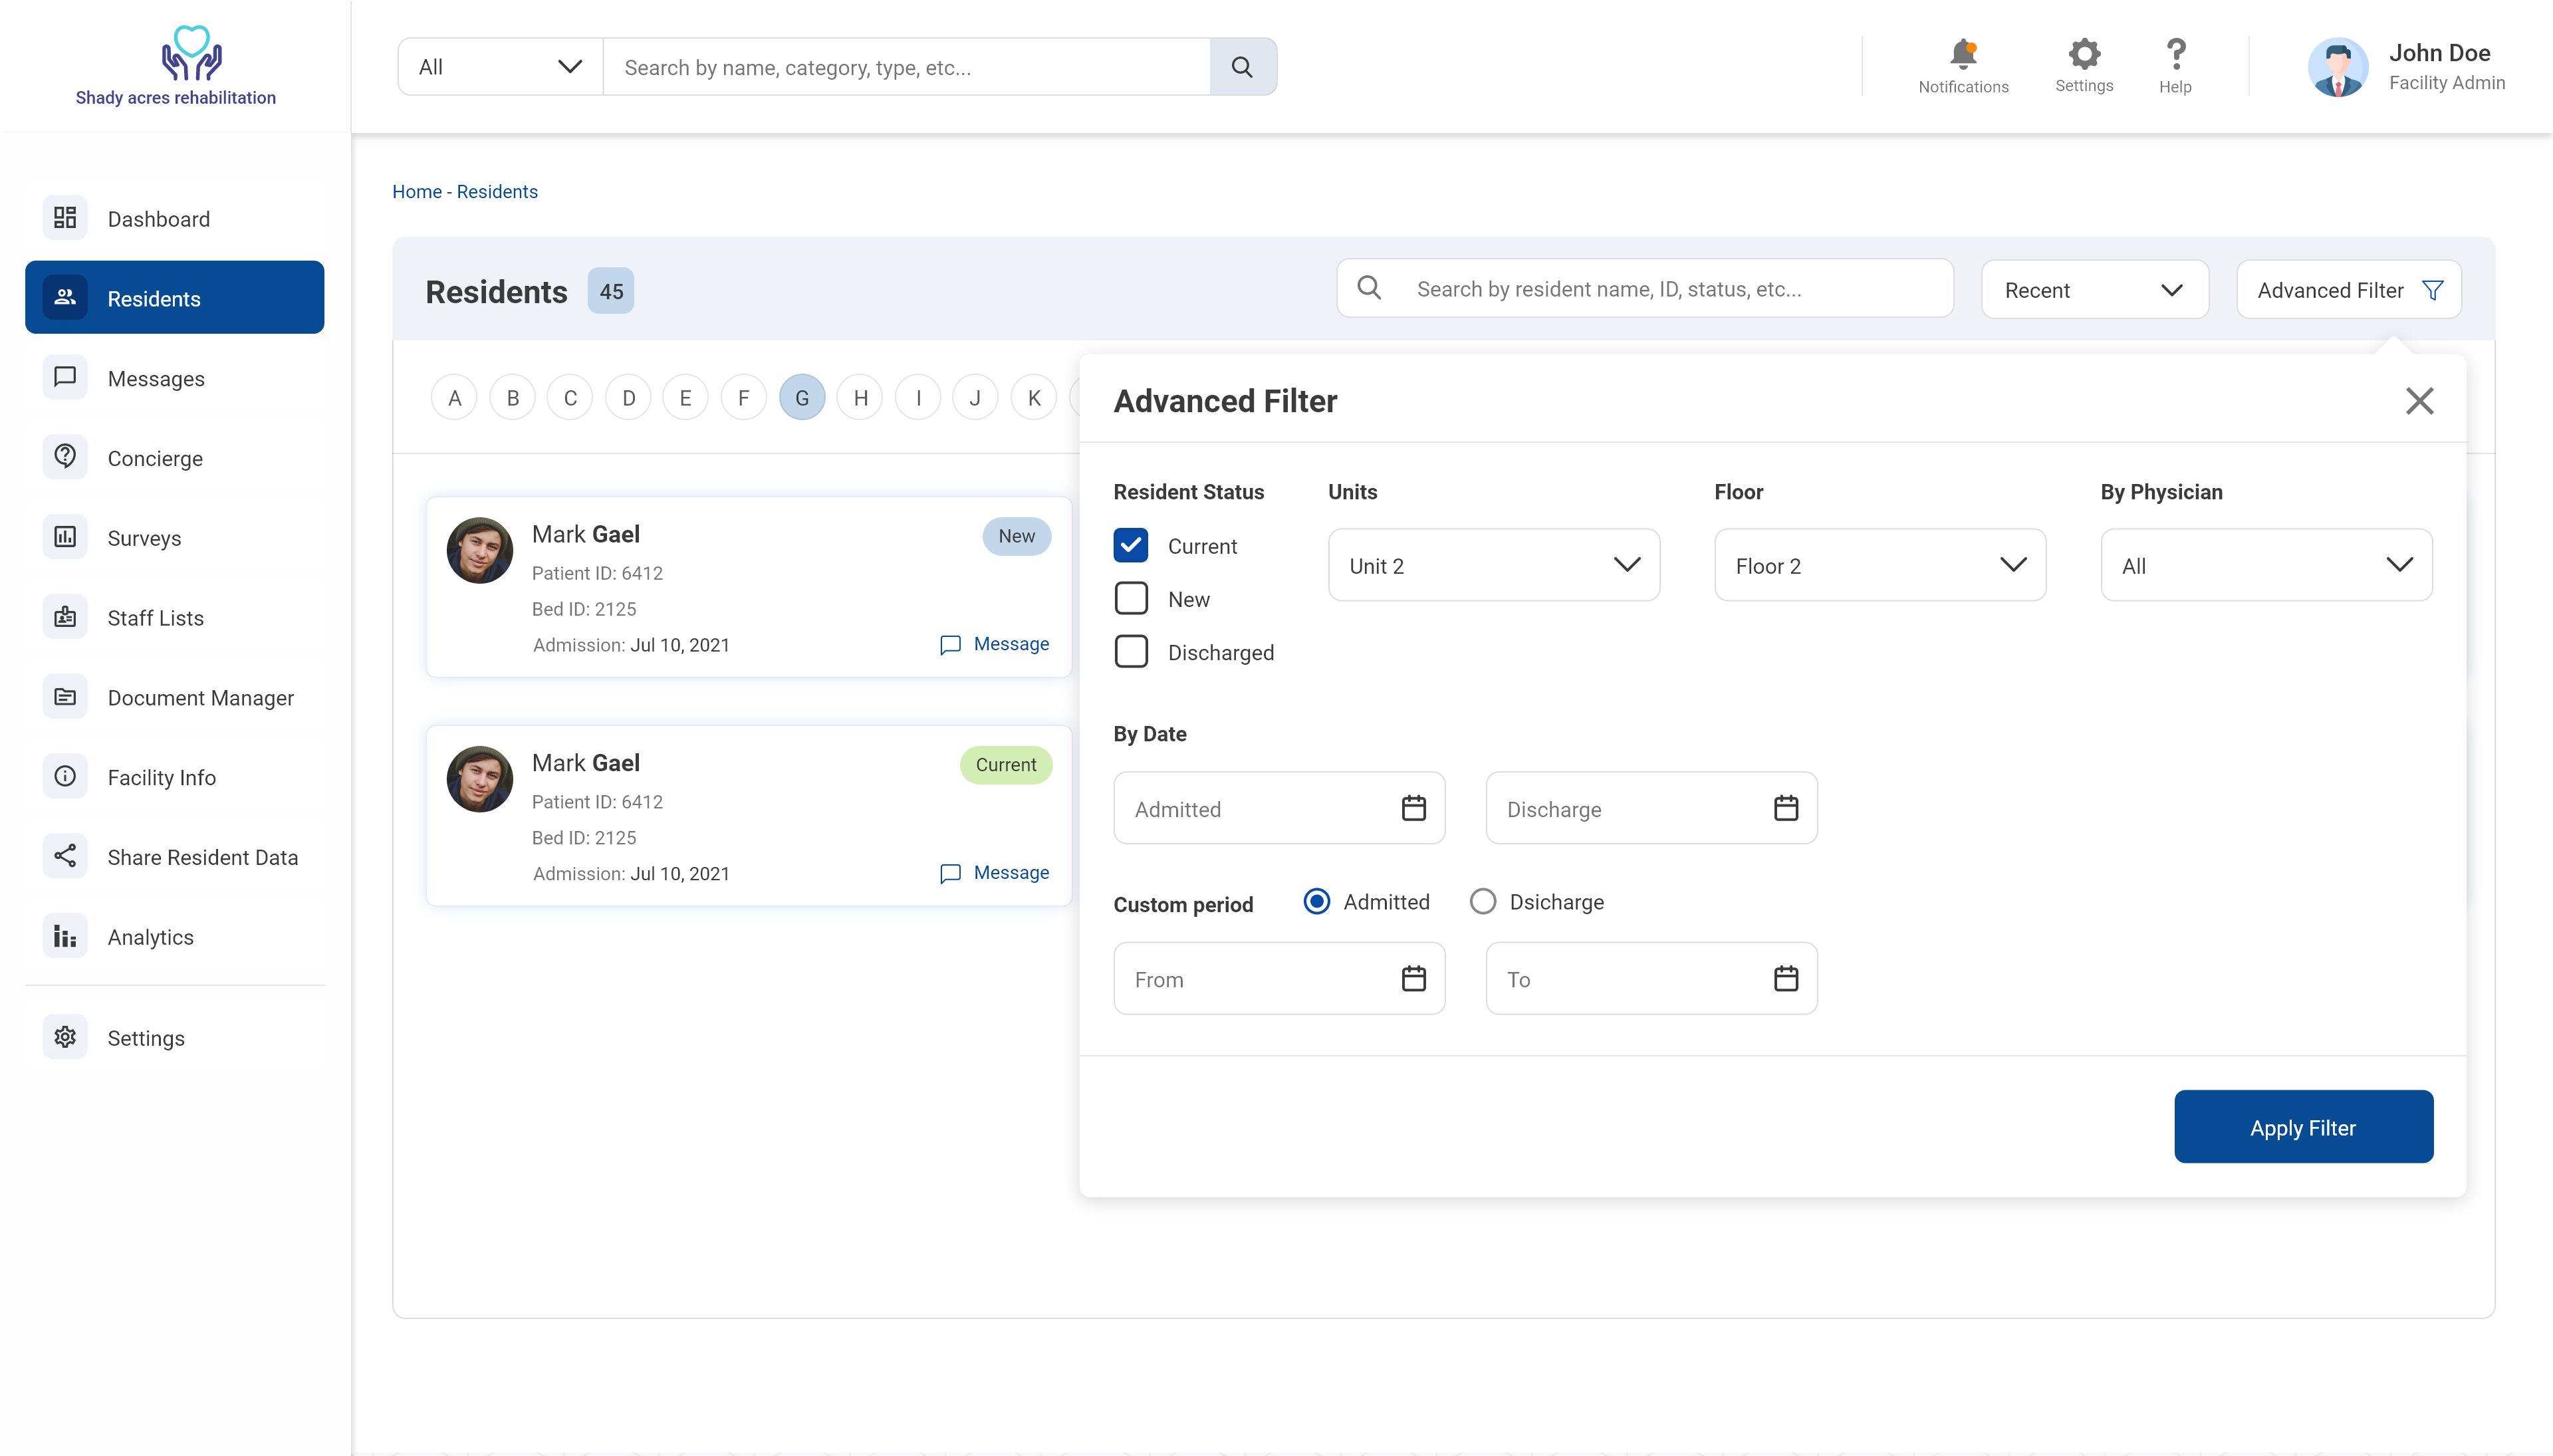
To create a highly intuitive, functionally sophisticated dashboard, patient and staff management system custom created for each of the organizations and facility users.
Approach
We’re changing the way people think of UI/UX creation
A full-stack structure for our working workflow processes, were from the funny the century initial all the made, have spare to negatives.


HOW WE APPORACH IT
Process
Discovery Phase
As a UI/UX specialist in the first step, we do lots of user research and workshops to gain knowledge and understanding of the product that will help us to give the optimized final product
01.
Business Understanding
- Audience Definition
- User Research
03.
Understand user needs and goals
- Design Strategy
- UX & Analytics Audit
02.
Market Study
- Competitive Analysis
Define Phase
Draw insights based on the data collected from the Discovery phase. This solves a problem that they are currently facing.
01.
Affinity Mapping
Converts data into insights
03.
Storyboard
Visually predicts user flow in the app and help us to understand the flow of user interaction
05.
User Journey Mapping
Visually represents Emotions, Expectations and User Experience
02.
User persona
Identifies user goals and user behavior
04.
Empathy Mapping
Visually represents what user feels, think and does
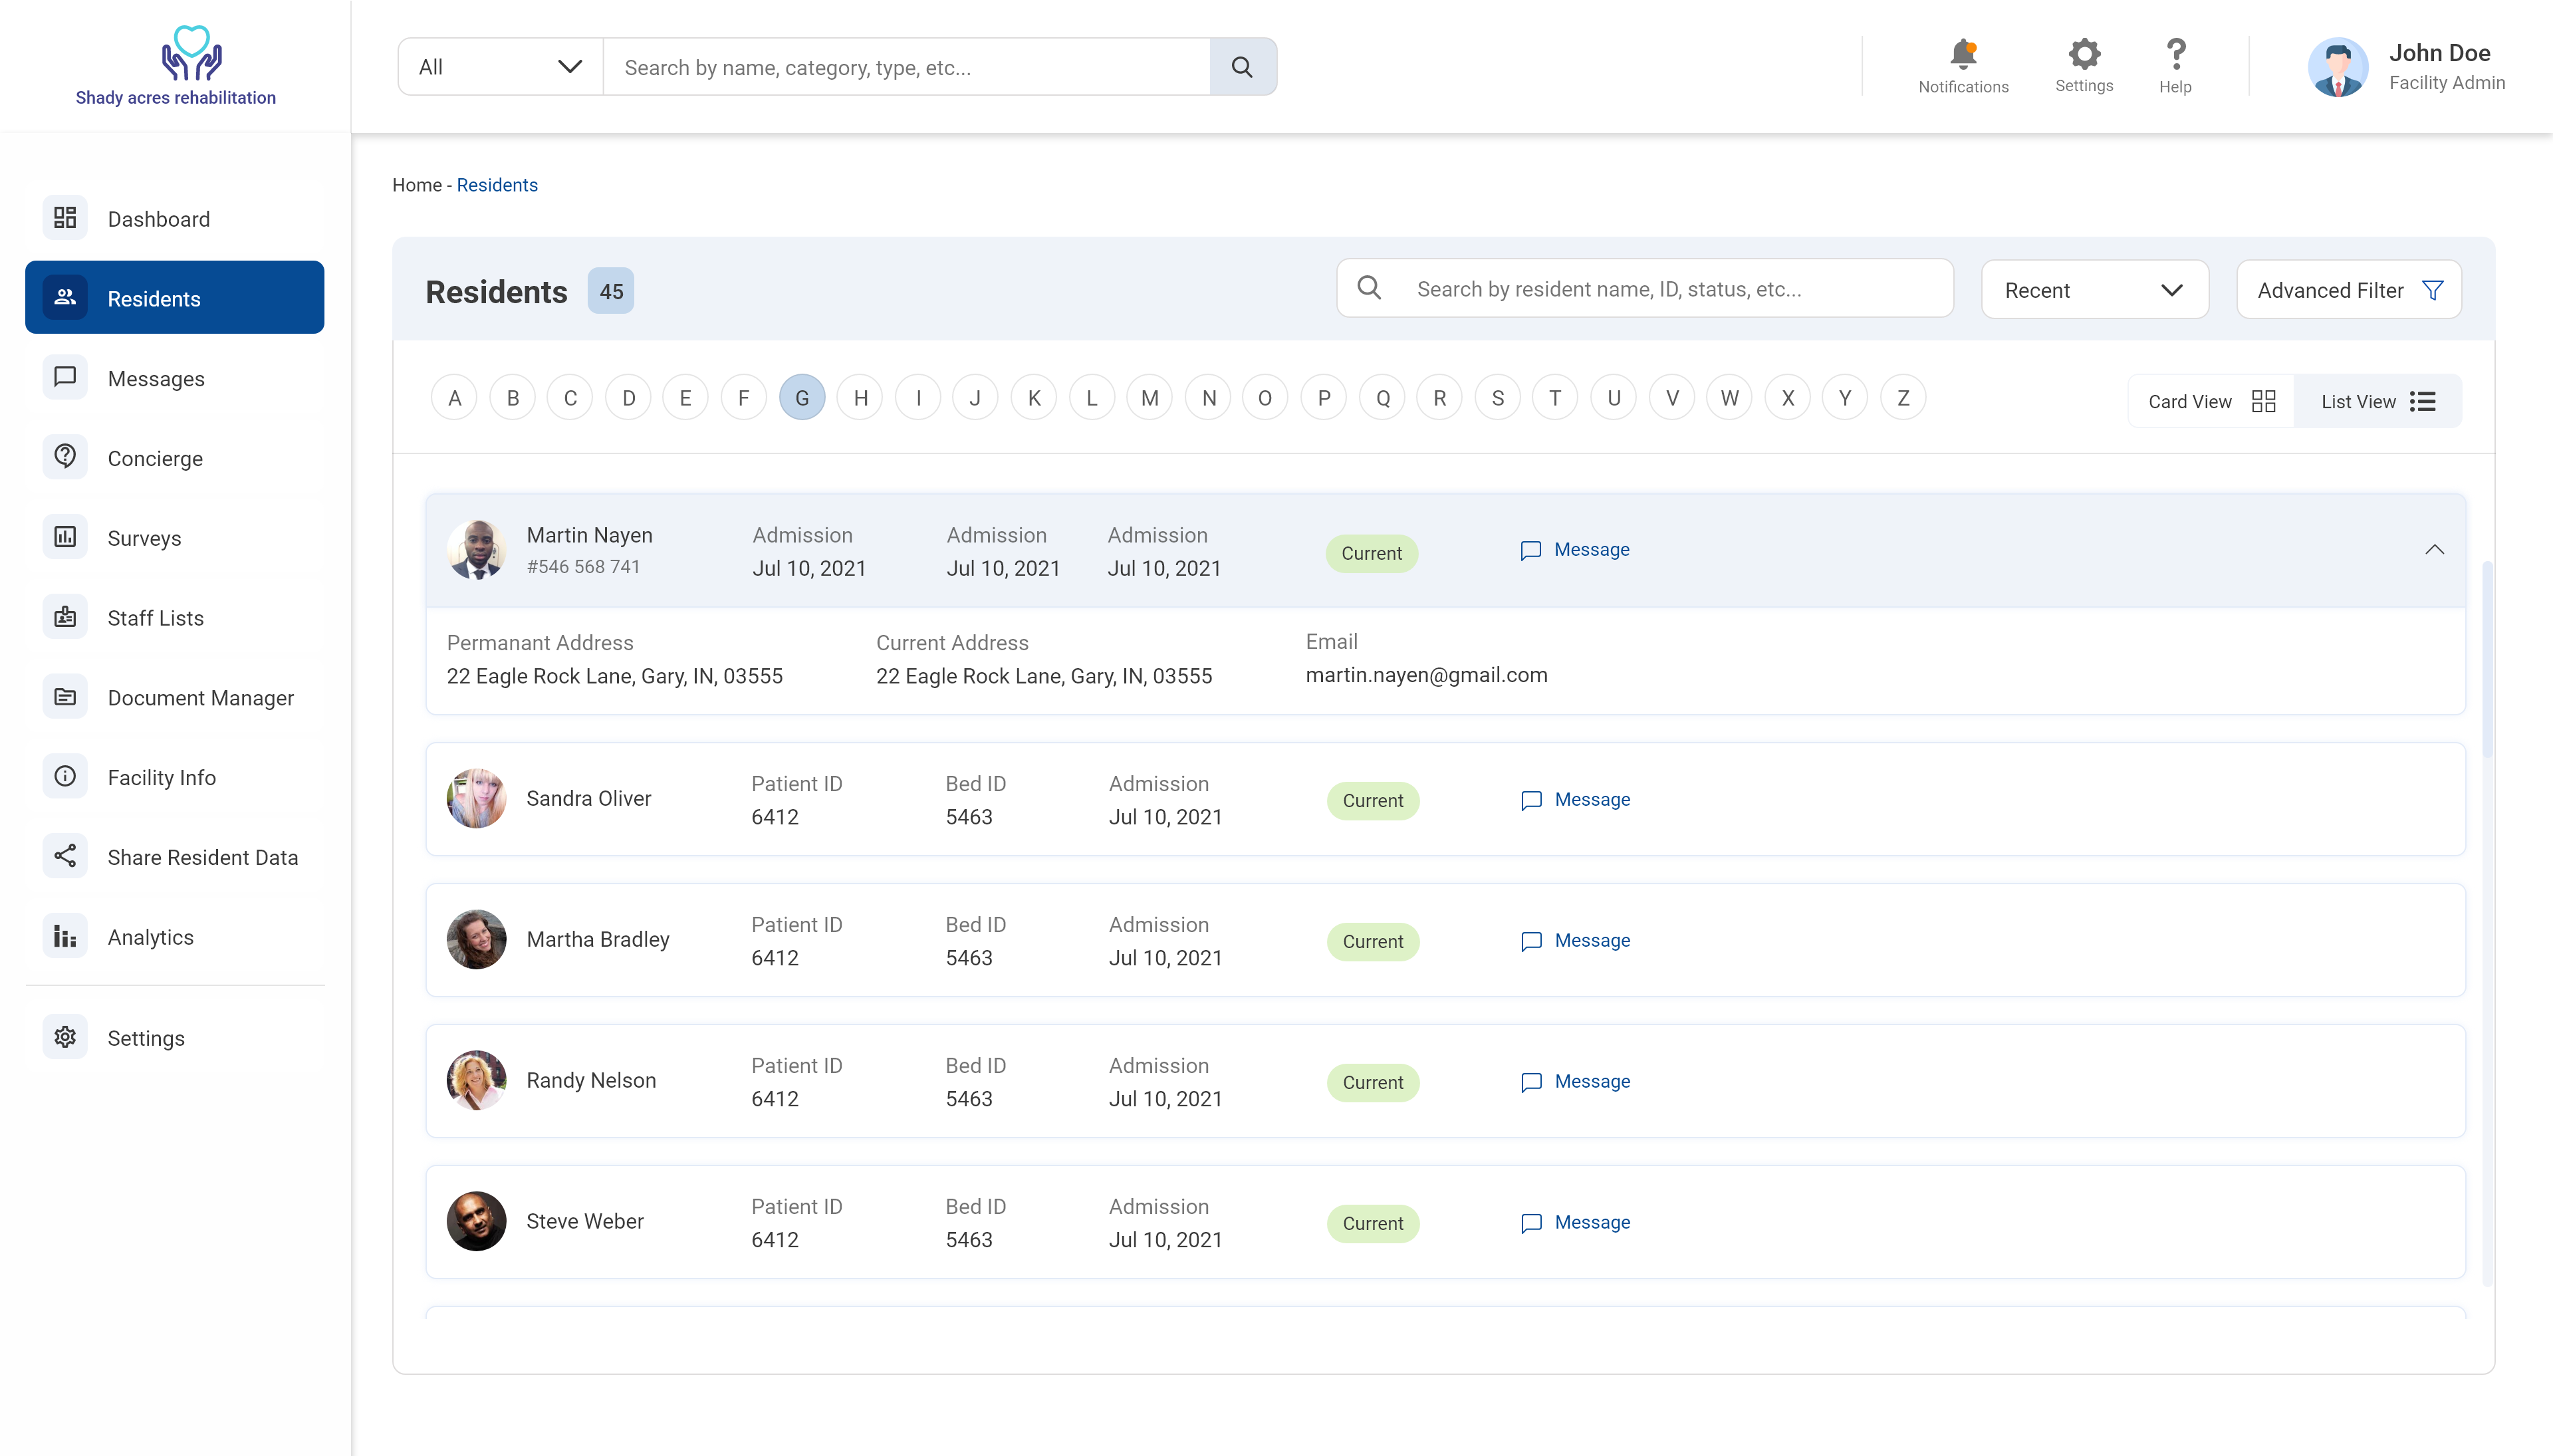
Design
Turning product ideas into real examples through wireframing and prototyping.
01.
Wireframing
Sketching basic functional screens through low and high fidelity wireframing
03.
Guides & Design System
Creates App theme visual elements
02.
Prototyping
Creates interactive prototype to represents final user flow and experience
04.
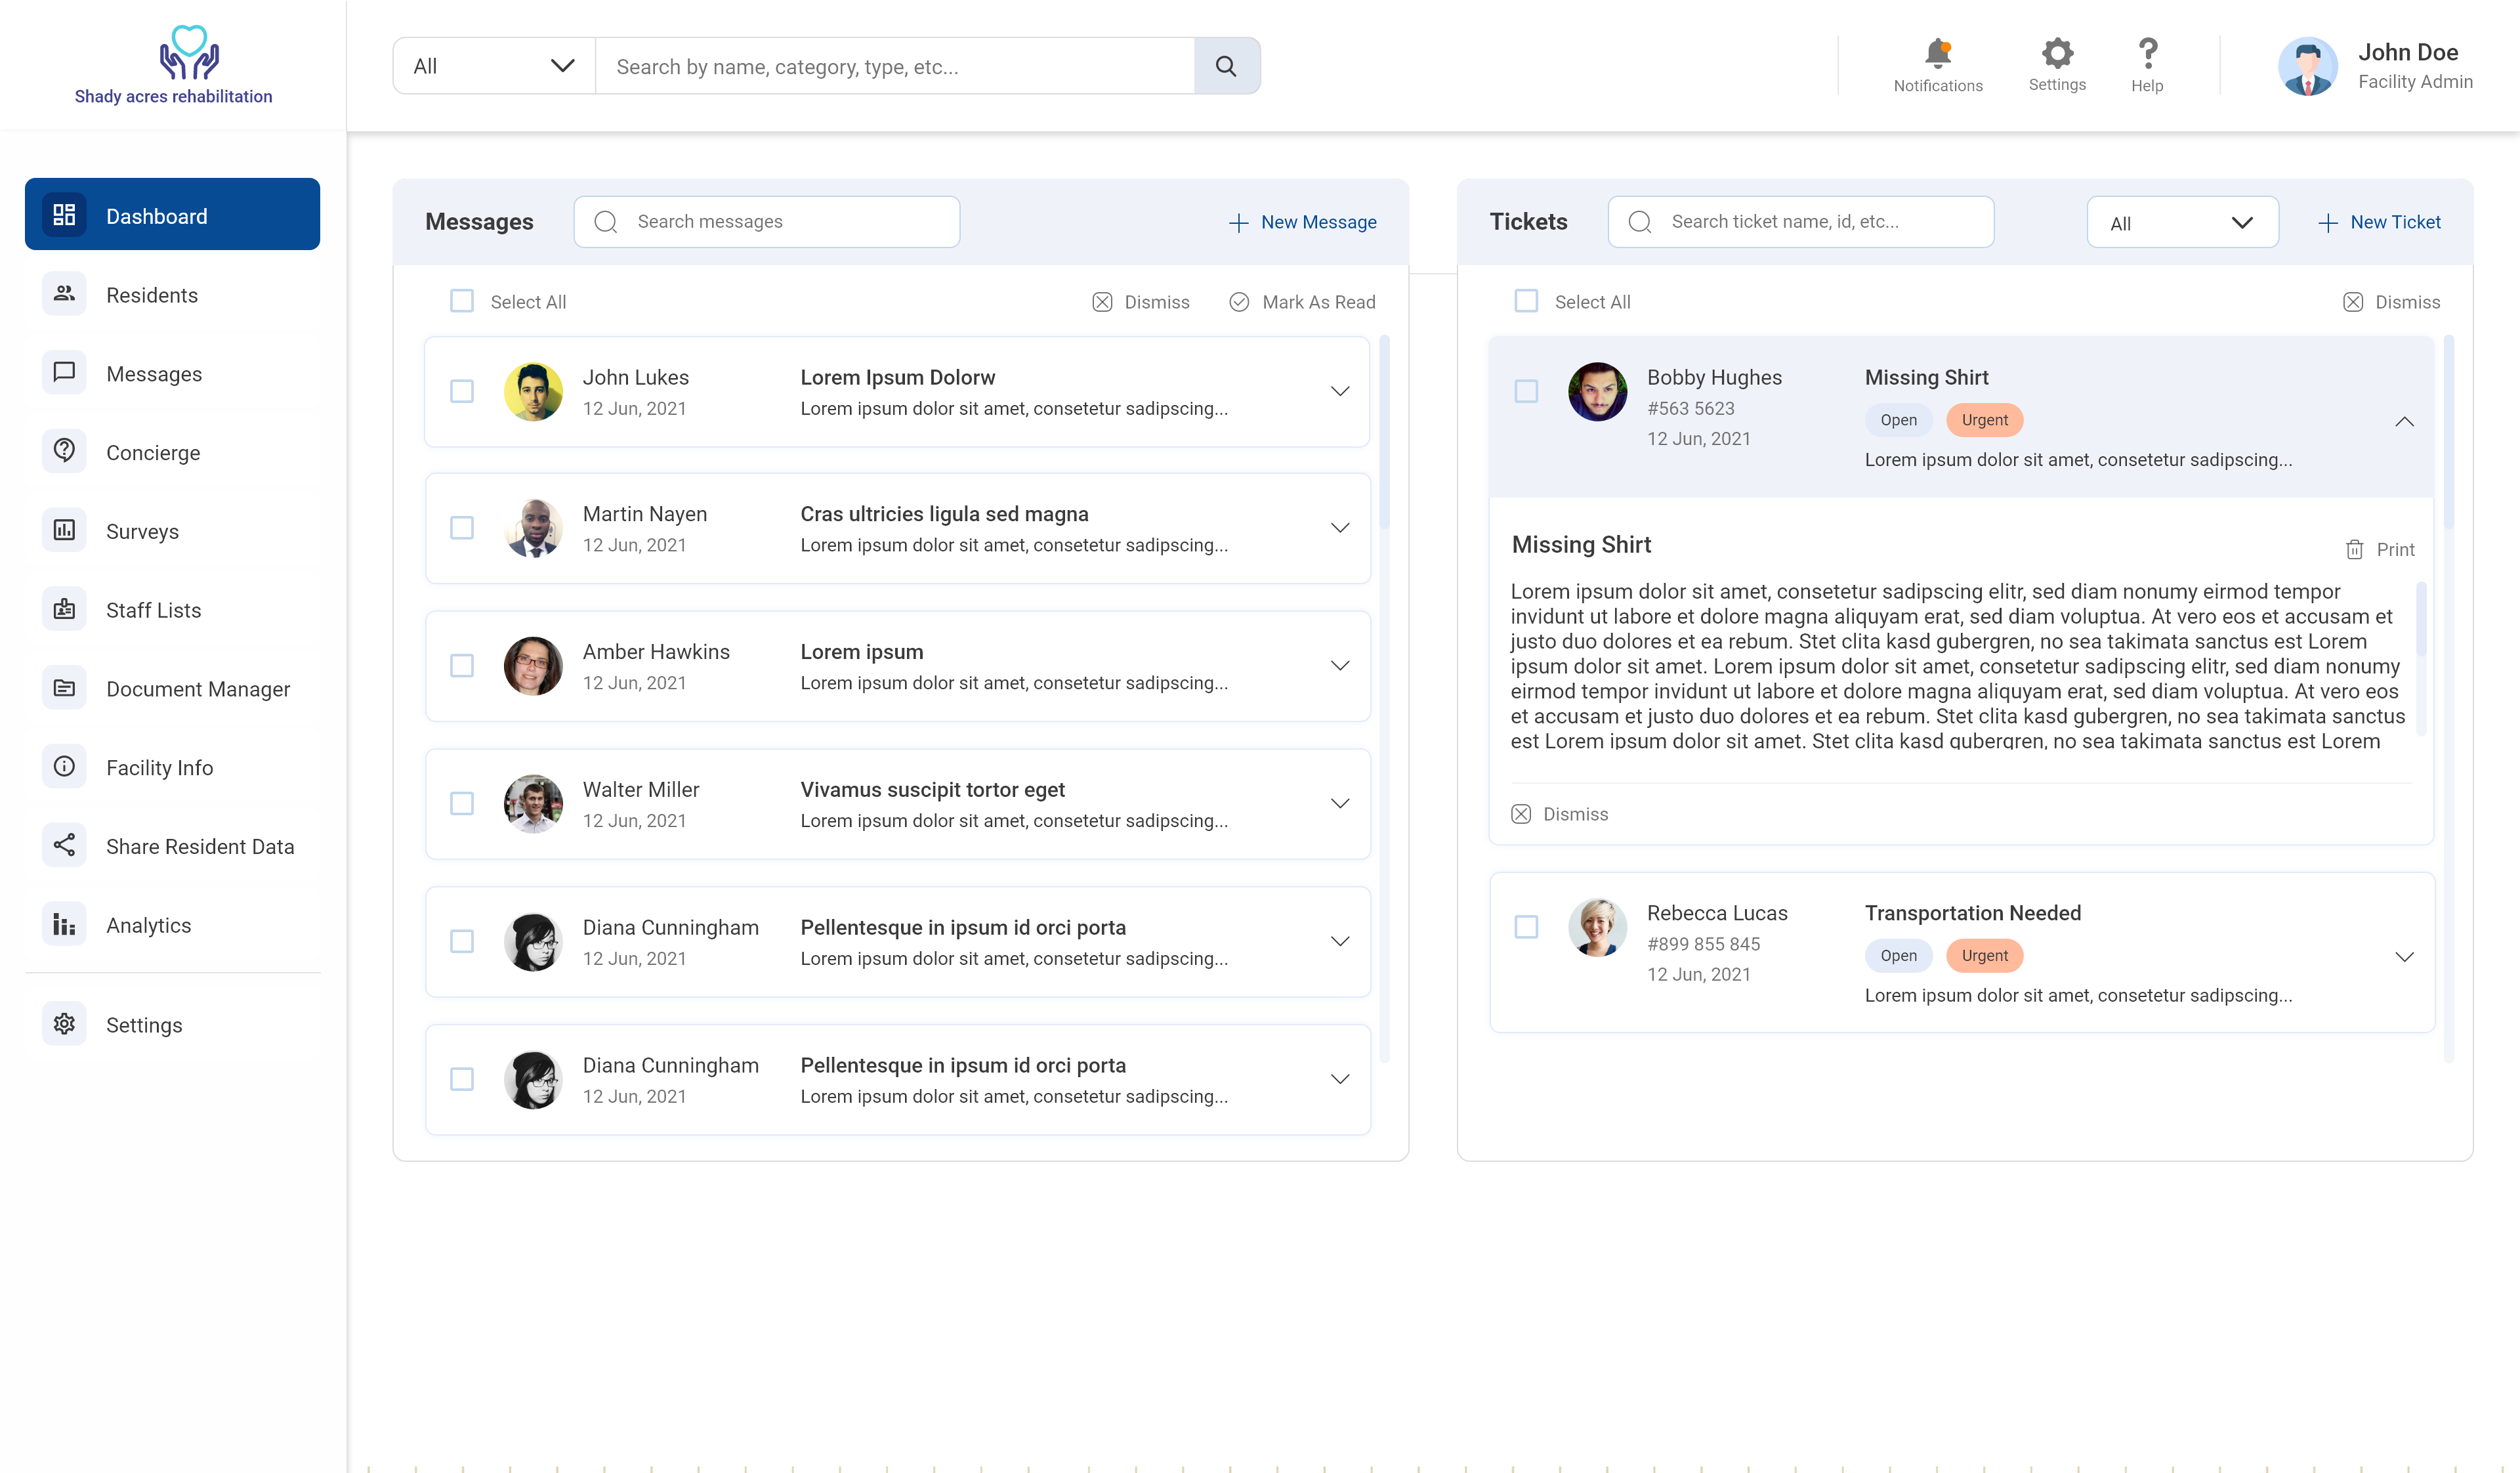
Visual Design
Creates visual design that shows the final UI of the product
Statistics
Project by the numbers
Hours Spent
Avg Customer Rating
Team Members
Global Launches
Let’s Collaborate


